Info Security Memo
  • Blog
  • Sitemap
    • Categories
  • Contact
  • About
  • Resources
  • Tools
  • 51sec.org

Build Confidence

Focusing on Information Security 

Info Security Notes

Juniper SRX DB mode (Debug mode)

5/26/2018

0 Comments

 
During our regular maintenance, after rebooted one SRX345, and found it stuck at db mode, which is debug mode.

After a short and quick analysis, I found Juniper JunOS devices may get stuck in the boot process or fail to boot the OS, in rare cases, after a sudden power loss or ungraceful power shut down. Juniper  routers, switches and firewalls  can experience file system corruption, which prevents the device from recovering to a functional state. It is recommended that customers minimize their log configurations to prevent excessive read/writes to the file system, which reduces the stress on storage media and reduces the potential occurrence of this issue. Moreover, if abrupt power failures are transient for a very short period of time, the availability of an UPS can also prevent the device from experiencing a sudden power loss.

You do not have to worry about damaging hardware in these situations, as the hardware cannot tell the difference between a graceful shutdown and pulling the power cord. The potential for damage is with the file system structure. It is possible for data to be corrupted, when the computer's power is interrupted with the operating system running. The data could be in the nodes, which could result in files being lost or file contents being corrupted.

Although rare, this issue more likely occurs on platforms that use a UNIX/BSD-based operating system, such as Junos, to access the flash-based storage media.

“Although rare, file system damage can occur with an abrupt power off, which may cause problems on the next boot. Use the request system halt or request system reboot command to gracefully shut down or reboot the OS. Once the OS is halted, it is safe to remove power.”  - from O'Reilly Media’s JUNOS Enterprise Switching book.

There are a couple of KB discussing the fix. KB29811 is using a USB to copy a snapshot from healthy device to faulty device. KB20046  suggest to press space to go to u-boot prompt and enter some commands to fix issue.


db> help
    DDB Quick Help  
  -------------------  
Type 'c' to continue, 'reset' or 'panic' to restart. 

print       p           examine     x           search      set         write       
w           delete      d           break       dwatch      watch       dhwatch     
hwatch      step        s           continue    c           until       next        
match       trace       alltrace    where       bt          call        show        
ps          gdb         reset       kill        watchdog    thread      panic       
ddbdumpsys  dumpsys     
db> reset


Read More
0 Comments

Juniper Space Security Director Policy Hit Counts Not Updated Automatically

12/2/2017

0 Comments

 
Issue Symptons:
  • Normally, each firewall rule on the SRX auto-updates a snmp counter for hit-count, regardless of whether 'count' is configured or not.  Juniper Space Security Director periodically polls these OIDs and updates the hit-count.   
  • In Junper Space 16.1 R1, the issue found is unable to view policy hit counts from Juniper Space Security Director, but SRX itself is keep updating. 

Actions Taken:
  • Verify Security Appliance Policy Hits from Command line
root@fw-mgmt-2> show security policies hit-count 
node1:
--------------------------------------------------------------------------

Logical system: root-logical-system
 Index   From zone        To zone           Name           Policy count
 1       Vlan2              Vlan1        Baramondi_Monitor 0            
 2       Vlan2              Vlan1        10             4428         
 3       Vlan2              Vlan1        50             0            
 4       Vlan2              Vlan1        40             11136        
 5       Vlan2              Vlan1        default-logdrop 0            
 6       Vlan2              Vlan1        53             2007         
 7       Vlan2              Vlan1        54             0            
 8       Vlan2              Vlan1        55             0            
 9       Vlan2              MGMT              6              538          
 10      Vlan2              MGMT              23             0            
 11      Vlan2              MGMT              74             2            
 12      Vlan2              MGMT              default-logdrop 81           
 13      Office              Vlan1        default-logdrop 0            
 14      Office              Vlan1        60             447          
 15      Office              Vlan1        Office_Archive    0            
 16      Office              Vlan1        58             0            
 17      Office              Vlan1        Baramondi_Monitor-1 0            
 18      Office              MGMT              Office_Archive-1  0            
 19      Office              MGMT              default-logdrop 0            
 20      Vlan1       Vlan2               Baramondi_Rules 0            
 21      Vlan1       Vlan2               VA             0            
 22      Vlan1       Vlan2               A_Office_2_Vlan2    292          
 23      Vlan1       Vlan2               default-logdrop 1696         
 24      Vlan1       Office               VA-1           0            
 25      Vlan1       Office               Baramondi_Rules-1 0            
 26      Vlan1       Office               Device-Zone-1  0            
 27      Vlan1       Office               4              1299         
 28      Vlan1       Office               default-logdrop 0            
   ........


It is clearly there is hit counts on SRX itself, but they are not being pulled/pushed into Space. Log collecter has beenconfigured and it is receiving logs from this SRX.

Read More
0 Comments

Juniper Space License Issue on Citrix Xen Environment

4/16/2017

0 Comments

 
Based on Juniper "Junos Space Virtual Appliance Installation and Configuration Guide" , JunOS Space " must deploy the virtual appliance on a VMware ESX, VMWare ESXi or KVM server, which provides a CPU, hard disk, RAM, and a network controller, but requires installation of an operating system and applications to become fully functional."

In my test environment, one JunOS Space has been installed on Citrix Xen environment and it is working fine until we tried to import a license.

The license was generated from Juniper License site and emailed to us in a txt file. It used to work on another machine hosted in Vmware ESX environment. Unfortunately, this time, JunOS Space said no.

The License Information windows says:
License upload failed. Please check the following:
1) License data format
2) License Keys
Juniper Space VE at Citrix Xen Server - License Error


Read More
0 Comments

Add Juniper SRX Cluster into JunOS Space 16.1 Security Director

4/16/2017

0 Comments

 
My old post "Import Existing Juniper SRX Cluster into JunOS Space Security Director" was created based on Space 14.1 and SRX11.x version. Now both have been upgraded. Space NMP and Security Director have been upgrade to 16.1 (Post is here). SRX240H has been upgrade to 12.1D46.55.

Basically, all steps are similar except the web interface is different. What you need to do is to configure your SRX cluster with a master-only ip on both nodes. The configuration should looks like this:


Read More
0 Comments

Juniper JunOS Space Upgrade Procedures from 14.1 to 16.1

3/19/2017

0 Comments

 
Usually you can easily upgrade an application from the Junos Space user interface. You must download the image file for the new version of the application, navigate to the Applications page (Network Management Platform > Administration > Applications) and select the application that you want to upgrade. From the right-click menu, choose Upgrade Application to upload the image file into Junos Space via HTTP or SCP.

But upgrade JunOS Space to latest version 16.1 is different and it is not a easy task. There are many steps to follow especially the last step to upgrade to 16.1 from 15.2R2. Here is my recent upgrade procedures.

Steps to upgrade JunOS Space 14.1  to the latest version 16.1:


Read More
0 Comments

Juniper Firewall SRX240H Crashed with Error 'nearing maxproc limit by uid 0,please see tuning(7) and login.conf(5)'

1/12/2017

0 Comments

 
One of Juniper Firewall SRX240H had a serious crash. Manual reboot/shutdown did not work. To reset it, I would have to do a hard reset / power cycle device.

It would allow to log in from console, but you wont be able to see any configuration.

Here is outputs from this crashed Juniper SRX240H console:


Read More
0 Comments

Juniper SRX340 HA Configuraiton

10/8/2016

0 Comments


Read More
0 Comments

Understanding Juniper SRX TCP Security Check

12/17/2015

0 Comments

 
Juniper SRX is a stateful firewall and allows traffic which matches an existing session. Sessions are created when a TCP SYN packet is received and it is permitted by the security policy. This of course means that the firewall needs to see both directions of a flow (client-server and server-client), otherwise these checks will block legitimate packets.

Following flow chart illustrates packet flow sequences both when SYN flag checking is enabled and when it is disabled.
SYN Flag Checking

By default, security TCP check is enabled on all TCP flow sessions. The Junos operating system (Junos OS) performs the following operations during TCP sessions:

  • Checks for SYN flags in the first packet of a session and rejects any TCP segments with non- SYN flags that attempt to initiate a session.
  • Validates the TCP sequence numbers during stateful inspection.

Reset packet is turned off for non-SYN session TCP packets:
{primary:node0}
root@fw-mgmt-trn1-1> show security zones
node0:
--------------------------------------------------------------------------

Security zone: MGMT1
  Send reset for non-SYN session TCP packets: Off
  Policy configurable: Yes
  Interfaces bound: 1
  Interfaces:
    reth4.201

Security zone: TSMGMT
  Send reset for non-SYN session TCP packets: Off
  Policy configurable: Yes
  Interfaces bound: 1
  Interfaces:
    reth4.198

Security zone: MGMT2
  Send reset for non-SYN session TCP packets: Off
  Policy configurable: Yes
  Interfaces bound: 1
  Interfaces:
    reth3.0
We can enable reset packets when received non-syn tcp session packets.
{primary:node0}[edit]
root@fw-mgmt-1# set security zones security-zone MGMT1 tcp-rst

{primary:node0}[edit]
root@fw-mgmt-1# set security zones security-zone TSMGMT tcp-rst

{primary:node0}[edit]
root@fw-mgmt-1# set security zones security-zone MGMT tcp-rst        

Check the settings again:
root@fw-mgmt-1> show security zones 
node0:
--------------------------------------------------------------------------

Security zone: MGMT1
  Send reset for non-SYN session TCP packets: On
  Policy configurable: Yes  
  Interfaces bound: 1
  Interfaces:
    reth4.201

Security zone: TSMGMT
  Send reset for non-SYN session TCP packets: On
  Policy configurable: Yes  
  Interfaces bound: 1
  Interfaces:
    reth4.198

Security zone: MGMT2
  Send reset for non-SYN session TCP packets: On
  Policy configurable: Yes  
  Interfaces bound: 1
  Interfaces:reth3.0


Junos OS provides a mechanism for disabling security checks on TCP packets to ensure interoperability with hosts and devices with faulty TCP implementations. During no-SYN-check the Junos OS does not look for the TCP SYN packet for session creation. No-sequence check disables TCP sequence checking validation. Also, increases throughput. SYN check and sequence check are enabled by default. The set security flow command disables TCP SYN checks and TCP sequence checks on all TCP sessions thus reduces security. This may be required in scenarios with customers like big transfer files, or with applications that do not correctly work with standards.

Another reason to disable syn-check and sequence-check is the asymmetric flows in your environment. It is best, whenever possible, to ensure that asymmetric flows do not occur; but this is not always possible. So, you can disable these checks globally on the SRX device.

To disable TCP packet security checks:
set security flow tcp-session no-syn-check
set security flow tcp-session no-sequence-check

After you disabled the tcp options, tcp-syn-check, and tcp-sequence-check that are configured at global level, you might want to configure TCP packet security checks at the policy level.

Note: Disabling the global SYN check and enforcing the SYN check after policy search will greatly impact the number of packets that the router can process. This in turn will result in intense CPU operations.

Configure the checking for the TCP SYN bit before creating a session:
[edit]
user@host# set security policies from-zone Zone-A to-zone Zone-B policy pol1 then permit tcp-options syn-check-required

Configure the checking for sequence numbers in TCP segments during stateful inspection:
[edit]
user@host# set security policies from-zone Zone-A to-zone Zone-B policy pol1 then permit tcp-options sequence-check-required

It is also possible to disable TCP SYN or sequence checking on one policy and enable them on all other policies, an apply-group can be used to complete this configuration based on KB24566.


Reference:
  • [J-Series/SRX] Example: Configuring TCP SYN Check options on a per policy basis
  • [ SRX ] : How to selectively disable TCP SYN or Sequence checking
  • Understanding TCP SYN Checking - Juniper Networks
  • Example: Disabling TCP Packet Security Checks for SRX Series Services Gateways


0 Comments

Juniper SRX Logging Configuration

10/2/2015

1 Comment


1.Understand Juniper SRX logging Type:

1.1 System Logging

SRX Series devices can send system log messages from the control plane (Routing Engine) to one or more destinations. Destinations can include local files on the SRX Series device (because the SRX Series device is a syslog server), remote syslog servers, user terminals, and the system console.

admin@fw-1> show configuration system syslog
archive size 750k files 2;
user * {
    any emergency;
}
host 10.9.0.33 {
    any any;
    change-log none;
    interactive-commands none;
    explicit-priority;
}
host 10.9.8.52 {
    any any;
    source-address 10.9.8.20;
}
file messages {
    any critical;
    authorization info;
    explicit-priority;
}
file interactive-commands {
    interactive-commands error;
}
}


1.2 Traffic Logging (Event Mode)

You can use traffic logs to track usage patterns or troubleshoot issues for a specific policy. You can configure a policy so that traffic information is logged when a session begins (session-init) and/or closes (session-close). To generate traffic logs for multiple policies, you must configure each policy to log traffic information. You also must configure syslog messages with a severity level of info or any. In the default configuration, these messages and all other logging messages are sent to a local log file named messages.


admin@fw-1> show configuration system syslog
archive size 750k files 2;
user * {
    any emergency;
}
host 10.9.0.33 {
    any any;
    change-log none;
    interactive-commands none;
    explicit-priority;
}
host 10.9.8.52 {
    any any;
    source-address 10.9.8.20;
}
file messages {
    any critical;
    authorization info;
    explicit-priority;
}
file interactive-commands {
    interactive-commands error;
}
file traffic-create {
    any any;
    match RT_FLOW_SESSION_CREATE;
    structured-data;
}
file traffic-deny {
    any any;
    match RT_FLOW_SESSION_DENY;
}
file traffic-flow {
    user info;
    match RT_FLOW;
    archive size 1000k files 5 world-readable;
    structured-data;
}


admin@fw-1> show log ?
Possible completions:
  <[Enter]>            Execute this command
  <filename>           Name of log file
  IKELOG               Size: 270913, Last changed: Feb 15 2015
  PKITRACE             Size: 138153, Last changed: Oct 02 02:22:41
  PKITRACE.0.gz        Size: 98723, Last changed: Sep 27 05:12:14
  __jsrpd_commit_check__  Size: 6456, Last changed: Dec 21 2014
  appidd               Size: 0, Last changed: May 13 2014
  authd_libstats       Size: 0, Last changed: May 13 2014
  authd_profilelib     Size: 0, Last changed: May 13 2014
  authd_sdb.log        Size: 0, Last changed: May 13 2014
  authlib_jdhcpd_trace.log  Size: 0, Last changed: Jan 18 2015
  bin_messages         Size: 7, Last changed: May 13 2014
  chassisd             Size: 1173869, Last changed: Oct 01 22:54:45
  cosd                 Size: 98079, Last changed: Sep 20 11:36:47
  dcd                  Size: 251523, Last changed: Sep 21 14:25:57
  default-log-messages  Size: 612840, Last changed: Oct 02 02:19:39
  default-log-messages.0.gz  Size: 1027366, Last changed: Sep 20 18:45:01
  default-log-messages.1.gz  Size: 1323072, Last changed: Sep 20 18:30:00
  dfwc                 Size: 0, Last changed: May 13 2014
  e2e_events           Size: 239, Last changed: Sep 20 11:45:31
  eccd                 Size: 0, Last changed: May 13 2014
  ext/                 Last changed: May 13 2014
  flowc/               Last changed: May 13 2014
  fwauthd_chk_only     Size: 298, Last changed: Dec 21 2014
  ggsn/                Last changed: May 13 2014
  gprsd_chk_only       Size: 1335, Last changed: Dec 21 2014
  gres-tp              Size: 23569, Last changed: Sep 20 11:36:47
  group_db.log         Size: 0, Last changed: May 13 2014
  helplog              Size: 64, Last changed: Nov 17 2014
  hostname-cached      Size: 408, Last changed: Dec 21 2014
  httpd.log            Size: 1533, Last changed: Sep 20 18:36:17
  idpd                 Size: 0, Last changed: May 13 2014
  idpd.addver          Size: 185, Last changed: Sep 20 19:15:01
  idpd_err             Size: 208962, Last changed: Sep 20 19:15:11
  idpd_err.1           Size: 1048851, Last changed: Sep 20 18:55:14
  ifstraced            Size: 120, Last changed: Dec 21 2014
  indb                 Size: 967833, Last changed: Dec 21 2014
  install              Size: 3927, Last changed: Dec 21 2014
  interactive-commands  Size: 82, Last changed: Sep 21 14:25:52
  inventory            Size: 17170, Last changed: Sep 20 11:45:34
  ipfd                 Size: 97046, Last changed: Sep 28 10:01:08
  ipfd_chk_only        Size: 32, Last changed: Dec 21 2014
  jdhcpd_era_discover.log  Size: 8892, Last changed: Oct 01 20:07:42
  jdhcpd_era_discover.log.0  Size: 43387, Last changed: Aug 13 23:11:34
  jdhcpd_era_discover.log.1  Size: 25529, Last changed: Jun 19 14:49:47
  jdhcpd_era_discover.log.2  Size: 422808, Last changed: Apr 17 16:00:00
  jdhcpd_era_discover.log.3  Size: 0, Last changed: Jan 18 2015
  jdhcpd_era_solicit.log  Size: 595, Last changed: Sep 20 11:36:47
  jdhcpd_era_solicit.log.0  Size: 595, Last changed: Jul 19 13:01:48
  jdhcpd_era_solicit.log.1  Size: 595, Last changed: May 17 12:26:15
  jdhcpd_era_solicit.log.2  Size: 595, Last changed: Jan 18 2015
  jdhcpd_era_solicit.log.3  Size: 0, Last changed: Jan 18 2015
  jdhcpd_sdb.log       Size: 0, Last changed: Jan 18 2015
  jsrpd                Size: 841811, Last changed: Sep 28 10:01:17
  kmd                  Size: 369441, Last changed: Sep 20 18:36:26
  license              Size: 0, Last changed: May 13 2014
  license_subs_trace.log  Size: 16976, Last changed: Sep 20 11:36:47
  lsys-cpu-utilization-log  Size: 0, Last changed: May 13 2014
  mastership           Size: 13036, Last changed: Sep 20 11:36:47
  messages             Size: 687915, Last changed: Oct 02 02:26:11
  messages.0.gz        Size: 38283, Last changed: Sep 26 05:45:00
  messages.1.gz        Size: 38105, Last changed: Sep 24 22:15:00
  nsd_chk_only         Size: 1021282, Last changed: Sep 29 18:26:35
  nstraced             Size: 58027, Last changed: Sep 20 11:43:30
  nstraced_chk_only    Size: 370, Last changed: Mar 18 2015
  pcre_db.log          Size: 0, Last changed: May 13 2014
  pf                   Size: 1152, Last changed: Dec 21 2014
  pfed                 Size: 0, Last changed: May 13 2014
  pfed_jdhcpd_trace.log  Size: 0, Last changed: Jan 18 2015
  pgmd                 Size: 385, Last changed: Dec 21 2014
  pkid                 Size: 828994, Last changed: Dec 21 2014
  rexp_db.log          Size: 0, Last changed: May 13 2014
  rsi.1400.0118        Size: 4620227, Last changed: Jan 18 2015
  rsi_2015_02_04       Size: 4762354, Last changed: Feb 04 2015
  rtlogd               Size: 3952, Last changed: Sep 29 18:26:56
  smartd.trace         Size: 133439, Last changed: Oct 01 23:51:05
  traffic-create       Size: 9307887, Last changed: Oct 02 02:26:11
  traffic-create.0.gz  Size: 593738, Last changed: Oct 02 02:15:00
  traffic-create.1.gz  Size: 679624, Last changed: Oct 02 02:00:00
  traffic-deny         Size: 733722, Last changed: Oct 02 02:26:11
  traffic-deny.0.gz    Size: 30893, Last changed: Oct 02 02:00:00
  traffic-deny.1.gz    Size: 29997, Last changed: Oct 02 01:30:00
  traffic-flow         Size: 14043535, Last changed: Oct 02 02:26:11
  traffic-flow.0.gz    Size: 1110300, Last changed: Oct 02 02:15:00
  traffic-flow.1.gz    Size: 1194867, Last changed: Oct 02 02:00:00
  traffic-flow.2.gz    Size: 1223703, Last changed: Oct 02 01:45:00
  traffic-flow.3.gz    Size: 1205868, Last changed: Oct 02 01:30:00
  traffic-flow.4.gz    Size: 1196097, Last changed: Oct 02 01:15:01
  user                 Show recent user logins
  utmd-av              Size: 960, Last changed: Sep 20 11:36:47
  utmp                 Size: 0, Last changed: May 13 2014
  |                    Pipe through a command

1.3 Notes:

System Logging Traffic Logging
SRX Branch Devices
SRX100
SRX110
SRX210
SRX220
SRX240
SRX550
SRX650
 KB16502  KB16509
SRX High-End Devices
SRX1400
SRX3400
SRX3600
SRX5600
SRX5800
 KB16502  KB16506


2. Understand Juniper SRX Logging Methods:

Control Plane and Data Plane

2.1 Control Plane Logging

 the control plane logs have to do with events triggered by daemons on the control plane. This includes messages about the underlying hardware (chassisd), general-purpose messages (messages), and various protocol daemons like IDPD, appidd, and so on. Control plane logging is on by default to log locally, but you can override this with your own logfiles, syslog hosts, and criteria for different log messages. All logs are stored in the /var/log directory on the control plane. It has been described at section 1.1

Services on the control plane:
  • Management Daemon (MGD):  Provides the interface between the UI components and the backend configuration and is responsible for acting on the Junos configuration to the system itself.
  • Routing Protocol Daemon (RPD) : All routing protocols including RIP, OSPF, IS-IS, BGP, PIM, IPv6 counterparts, and so on.
  • User interfaces: Console, Telnet, SSH, J-Web, NetConf.
  • Filesystem interfaces: FTP/SCP.
  • Syslogd: Logging subsystem on the control plane, different than what is on the data plane. This generates the OS and application logs on the control plane.
  • Networking services: DNS, DHCP, NTP, ICMP, ARP/ND, SNMP.
  • Chassisd: Controls the hardware operations of the data plane and interfaces with the components to ensure they are active and operating properly.
  • JSRPD: This is the high availability daemon that runs the HA functionality between two SRX chassis in an HA cluster.

2.2 Data Plane Logging

Data plane logs are primarily those generated by components that process traffic on the data plane. These include the firewall logs (RT_LOG, which stands for Real-Time Log because it is not stored on the data plane) from the flowd process, IPS logs, UTM logs, and logs from other security components like Screens. Data plane logging is off by default and must be configured. Typically, it is recommended that you send logs off the SRX to a syslog host due to the large volume of logs that can be generated from the data plane, particularly on high-end SRX platforms like the 5800. In fact, it can take an entire infrastructure of syslog servers to handle the large volume of syslog messages that the high-end SRX can generate per second. For this reason, there are two different mechanisms that we can use to log messages to the control plane, as discussed in the next section.

Services on the data plane:
  • Intrusion Detection and Prevention Daemon (IDPD)
  • IKED
  • PKID

2.2.1 Event Mode 

Event mode  - control plane log processing - used on low end devices. Optionally even rate can be specified. Once event mode is enabled under "security" then the logging to local file can configure under "system syslog" as above at section 1.2.  You also can configure that security traffic logs are handled through the eventd process and sent with system logs though control panel Routing Engine.

admin@fw-1> show configuration security
log {
    mode event;
    event-rate 1000;
    format sd-syslog;
    source-address 10.9.8.20;
    stream securitylog {
        format sd-syslog;
        category all;
        host {
            10.9.8.52;
        }
    }
    stream LogCollector {
        host {
            10.9.20.17;
        }
    }
    stream TO-10.9.20.33 {
        format sd-syslog;
        category all;
        host {
            10.9.20.33;
        }
    }
}


2.2.2 Stream Mode

Stream mode - data plane logging - Normally used on high end SRX devcies but can be configured on any SRX devices. Under security the syslog parameters can be specified, e.g. syslog server, syslog format, facility.

Note: SRX can only log to the control plane (Event mode) or log out the data plane (Stream mode) at one time

Security logs such as traffic and IDP logs are able to be streamed through the traffic interface ports to a remote syslog server. SRX devices do not send streamed session logs to the Routing Engine (RE). Because system logging is performed on the RE, session or traffic logs cannot be written to the RE file system. Therefore, all traffic logging must be sent to a remote syslog server. Because fxp0 belongs to the RE, the remote syslog server must be reachable by an interface on an IOC. Traffic logging cannot be sent out through fxp0.

When the logging mode is set to stream, security traffic logs generated in the data plane are streamed out a revenue traffic port directly to a remote server. That also means your local log file will stop logging. Match condition configuration in System -> Syslog part does not work in Stream mode.  Its as per design, the Routing engine is the one which puts the match condition and filters the log,
since when we use stream mode the traffic is streamed out of the data plane itself and doesn't reach the RE the match condition dose not work when using stream mode and only works in event mode.

Basically, only thing works at System - Syslog section are those generated from control plane.

admin@fw-twn1-1> show configuration security
log {
    cache;
    mode stream;
    format sd-syslog;
    source-address 10.2.2.13;
    stream TO-10-0-0-4 {
        format sd-syslog;
        category all;
        host {
            10.0.00.4;
        }
    }
    stream TO-10.4.20.33 {
        format sd-syslog;
        category all;
        host {
            10.4.20.33;
        }
    }
    inactive: traceoptions {
        file jtac;
        flag all;
    }
}


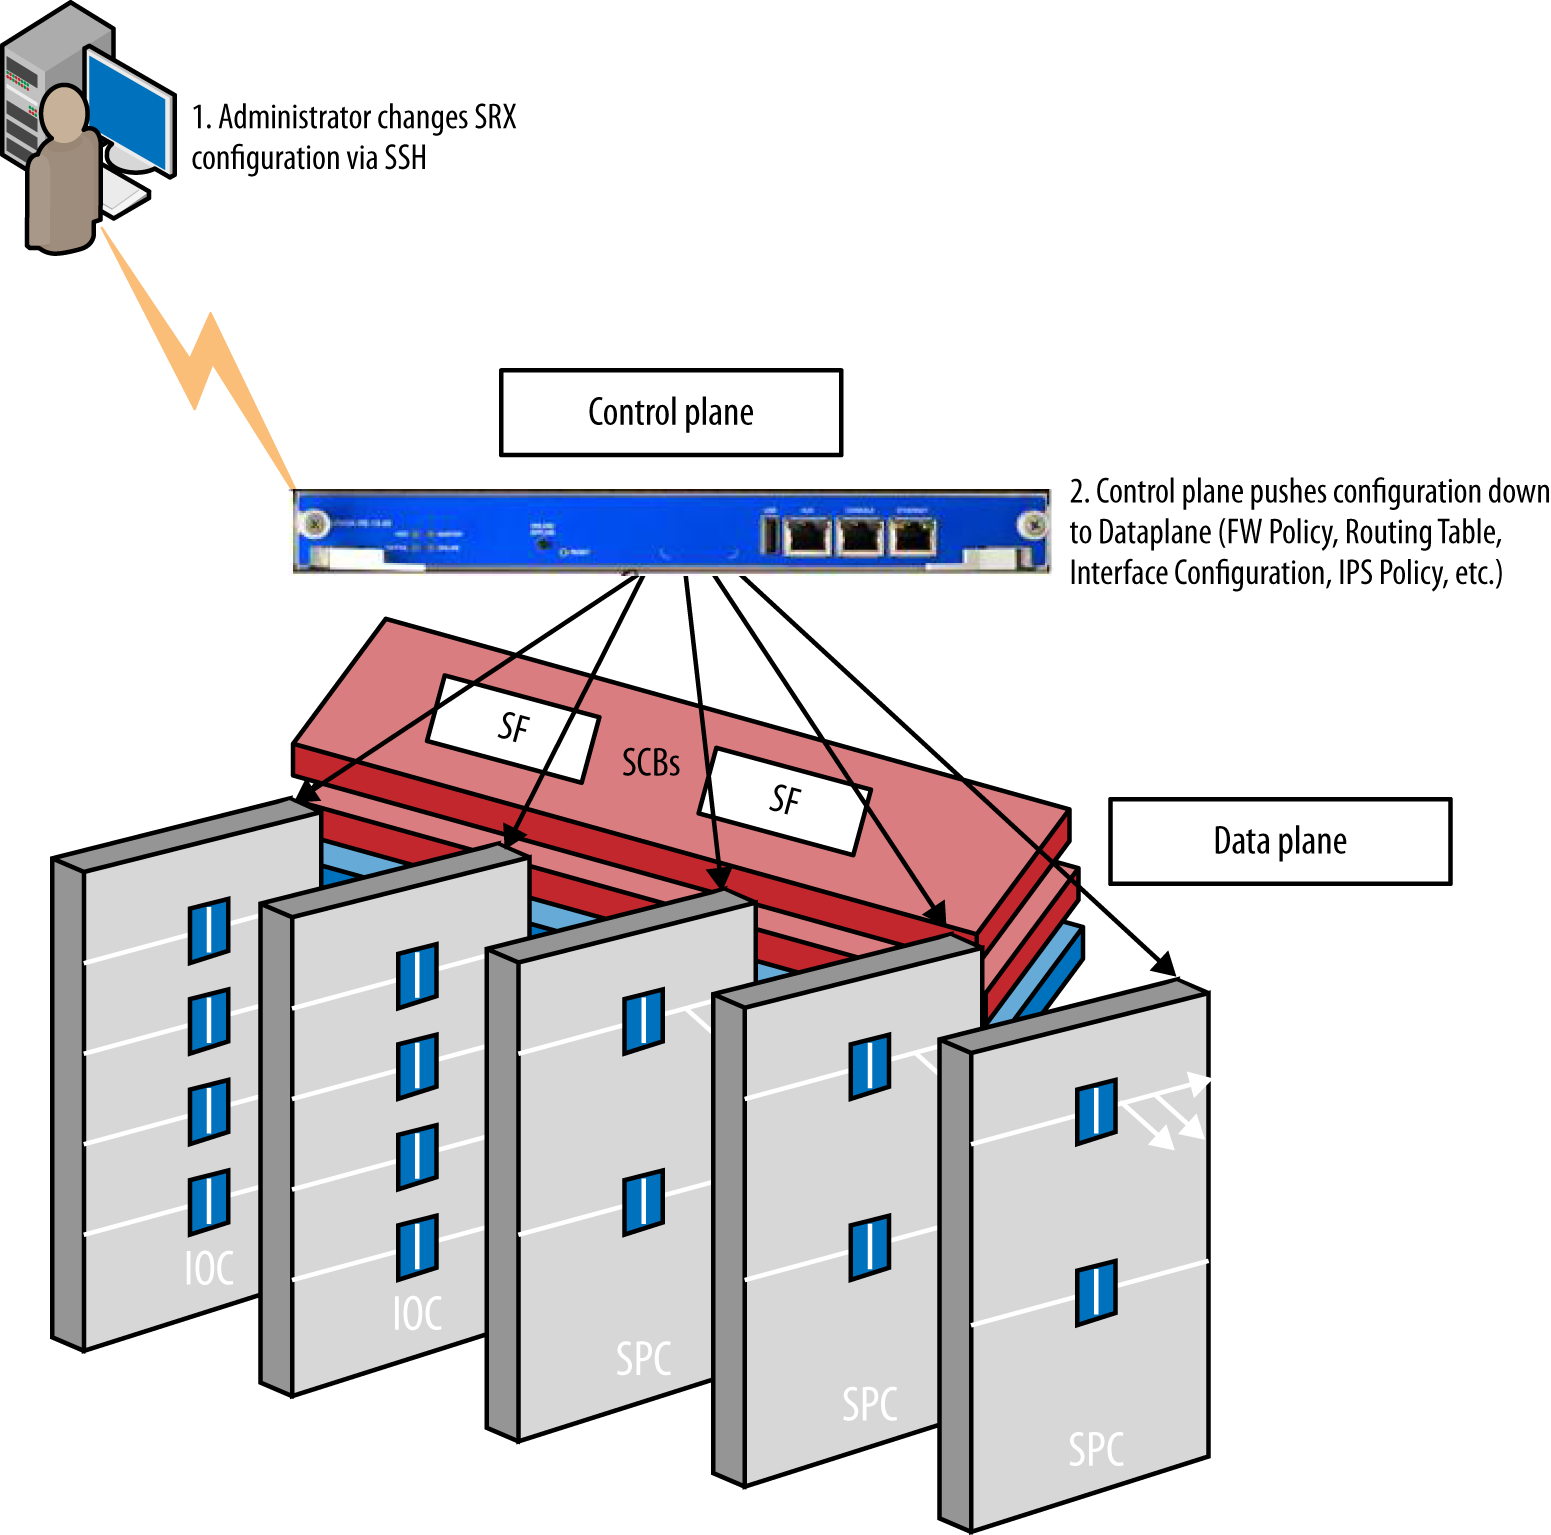
Control plane pushing configuration to data plane


admin@fw-srx1> show security log
Security logging is disabled

“show security log” will show you something about audit log but not policy logging after enabled cache in the security log section, else SRX will show you Security Log disabled.


After you enabled cache under security -> log configuration, as shown at the configuration of section 2.2.2, you will get output like below once you use command show security log:


admin@fw-1> show security log
Event time               Message
2015-10-02 09:15:04 UTC  UI_CMDLINE_READ_LINE: User 'root', command 'xml-mode netconf need-trailer '
2015-10-02 09:15:04 UTC  UI_LOGOUT_EVENT: User 'root' logout
2015-10-02 09:15:04 UTC  UI_LOGIN_EVENT: User 'root' login, class 'super-user' [55330], ssh-connection '10.4.20.21 7804 10.2.1.14 59097', client-mode 'cli'
2015-10-02 09:15:04 UTC  UI_CMDLINE_READ_LINE: User 'root', command 'xml-mode netconf need-trailer '


Reference:


  • Security logging is disabled
  • System Services
  • [SRX] Match condition for logging in system syslog does not work when mode in stream and works with event mode
  • Stream logging problems in SRX


1 Comment

JunOS Space Radius Authentication with Free Radius Server TekRADIUS

9/4/2015

0 Comments

 
TekRADIUS is a RADIUS server for Windows with built-in DHCP server. TekRADIUS is tested on Microsoft Windows XP, Vista, Windows 7/8/10 and Windows 2003/2008/2012 server. TekRADIUS complies with RFC 2865 and RFC 2866. TekRADIUS also supports TCP (RFC 6613) and TLS (RFC 6614-RadSec) transports. TekRADIUS has two editions; TekRADIUS(First edition; supports Microsoft SQL Server) and TekRADIUS LT (Second edition; supports SQLite). It runs as a Windows Service and comes with a Win32 management interface.  More feature can be checked from their website.

There are some previous usage posts in my blog:

  • TekRADIUS Usage for AD Authentication
  • Cisco Switch Radius Configuration Work With TekRADIUS AD Authentication
  • Troubleshooting Cisco Radius Configuration with Free Radius Server TekRadius

Those configuration have been proven working well with Checkpoint, Juniper and Cisco devices. Recently our Juniper NSM upgraded to Juniper Space platform. There were some challenges to set up TekRADIUS to work with JunOS Space during configuration. Here are all steps I did and so far it works.

1. Download and Install TekRADIUS

You can get installation file from download page. Current version is 4.9.9. You can use LT version which is SQLite version. Installation is quite straightforward, and configuration is simple as well. 

2.TekRADIUS configuration.

TekRADIUS configuration is able to be done from console window. Go through all tab interfaces and put necessary information in. Your Radius server should be able ready in 10 minutes. In my lab configuration, there are some groups defined in TekRADIUS group tab. Admin group is using active directory authentication and it will automatically log into cisco devices enable mode with privilege 15. All admiistrators defined in users tab will be nested in those groups.
Defined Groups

For the users in admin-read group, difference from admin group is not able to log into enable mode automatically. You will have to enter enable password manually from Cisco device. In admin-read group, there are no cisco-avpair attribute in Success-reply packets.

Radius Client Configuration

Radius Server Configuration

Cisco Attribute

3. JunOS Space Configuration

3.1 Authentication Server Configuration


Authentication Server

3.2 Define a Remote Profile 'admin'


Remote Profile - admin

3.3 Configure JunOS Attribute in TekRadius

Basically, returned authorization data in the RADIUS server are stored as vendor-specific attributes (VSAs). Therefore, you need to update the Juniper dictionary file (Vendor Juniper in Dictionary Editor) in the RADIUS server with the Junos Space defined VSA (Juniper-Junosspace-Profiles). Users in the RADIUS server database should be assigned to return this VSAs, the values of which must correspond to the remote profiles created in the Junos Space server.

3.3.1 Create a new VSA under Vendor Juniper 's attributes list
new vsa - Juniper-Junosspace-Profiles
3.3.2 Assign this new VSA attribute into the group admin
New Success-reply Attribute
Assign this attribute with a value 'admin', which is matching the JunOS Space remote profile name we created at step 3.2. This value will be returned to JunOS Space to do authorization once authentication succeed. 

4. Verify

You should be able to log in with your AD account name and AD password.

4.1 from TekRADIUS server

Here is log from TekRadius server.

01/09/2015 8:50:18 PM - Active Directory Authentication commencing for user 'yanjohn'
01/09/2015 8:50:18 PM - Check items control - Start (Group : admin).
01/09/2015 8:50:18 PM - Check items control - Stop (Group : admin).
01/09/2015 8:50:18 PM - Windows authentication successfull for user 'yanjohn'
01/09/2015 8:50:18 PM - Fetching Success-Reply items - Start.
01/09/2015 8:50:18 PM - Fetching Success-Reply items - Stop.
01/09/2015 8:50:18 PM - Generating Reply Packet - Start.
01/09/2015 8:50:18 PM - Generating Reply Packet - Stop.

RadAuth reply to  : 10.94.200.18:59944 - 01/09/2015 8:50:18 PM
Size              : 82
Identifier        : 24
Attributes        : 

Juniper-Junosspace-Profiles = admin
cisco-avpair = shell:priv-lvl=15
Service-Type = 7


4.2 from JunOS Space Audit Logging

Audit Log

Reference:

  • Configuring a RADIUS Server for Authentication and Authorization


0 Comments
<<Previous

    Categories

    All
    Architecture
    Blog
    Checkpoint
    Cisco
    Cloud
    CyberArk
    F5
    Fortigate
    Guardium
    Juniper
    Linux
    Network
    Others
    Palo Alto
    Qualys
    Raspberry Pi
    Security
    SIEM
    Software
    Vmware
    VPN
    Wireless

    Archives

    March 2024
    February 2024
    January 2024
    December 2023
    November 2023
    October 2023
    September 2023
    August 2023
    July 2023
    June 2023
    May 2023
    April 2023
    March 2023
    February 2023
    January 2023
    December 2022
    November 2022
    October 2022
    September 2022
    August 2022
    July 2022
    June 2022
    May 2022
    April 2022
    March 2022
    February 2022
    January 2022
    December 2021
    November 2021
    October 2021
    September 2021
    August 2021
    July 2021
    June 2021
    May 2021
    April 2021
    March 2021
    February 2021
    January 2021
    December 2020
    November 2020
    October 2020
    September 2020
    August 2020
    July 2020
    October 2019
    September 2019
    June 2019
    July 2018
    May 2018
    December 2017
    August 2017
    April 2017
    March 2017
    January 2017
    December 2016
    November 2016
    October 2016
    September 2016
    August 2016
    July 2016
    June 2016
    May 2016
    April 2016
    March 2016
    February 2016
    January 2016
    December 2015
    November 2015
    October 2015
    September 2015
    August 2015
    July 2015
    June 2015
    May 2015
    April 2015
    March 2015

    Print Page:

    RSS Feed

    Email Subscribe
Powered by Create your own unique website with customizable templates.
  • Blog
  • Sitemap
    • Categories
  • Contact
  • About
  • Resources
  • Tools
  • 51sec.org